Age and distribution of the UK population over the past 100 years
18 January 2022
To take from David Attenborough’s documentary (“A Life on our planet” – 2020) in his distinctive, soft and staccato tone: “A key reason the population is still growing is because many of us are living longer. At some point in the future, the human population will peak for the very first time. The sooner it happens, the easier it makes everything else we have to do.”
In our first article on longevity, we explored how survival rates within the UK population have increased over the past two centuries at all ages. However, this only provided one dimension to understanding the socio-economic impact of demographic changes. In this article, we look at the change in composition of the UK population by age group and sex over the last one hundred years.
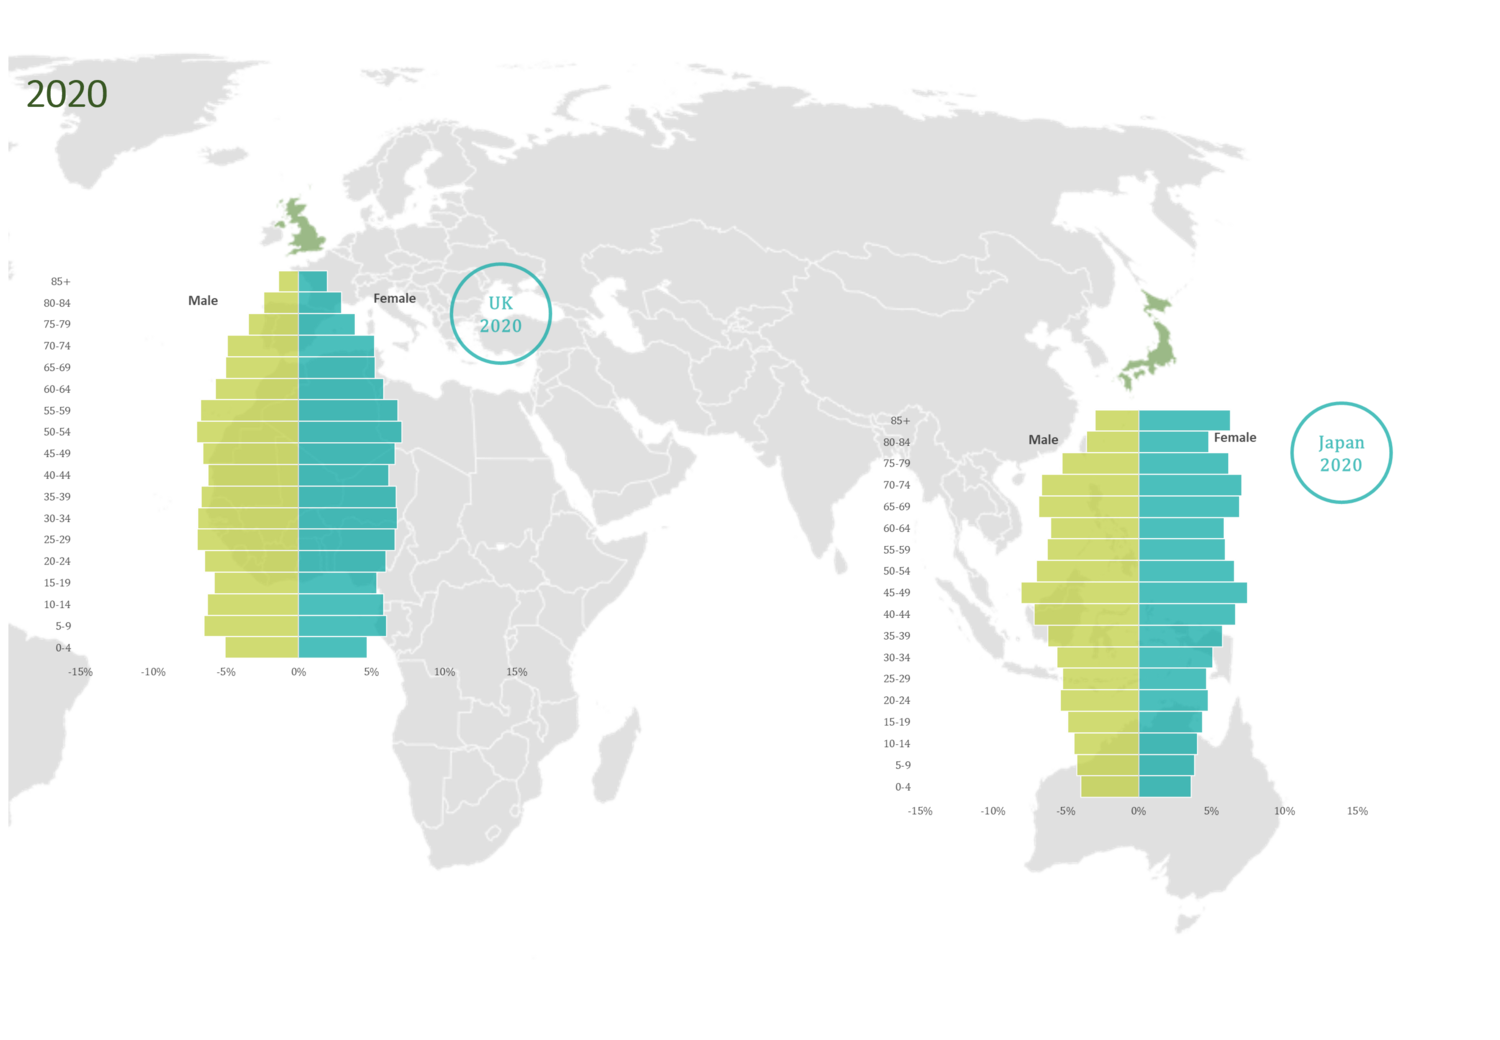
The population pyramid, showing male population on the left and female on the right as a percentage of respective total population, is built using stacked bars corresponding to 5-year age groups. This simple representation of the age stratification of society has served well in the past in shaping and understanding macroeconomic policies – how economic resources are produced and distributed often depends on the proportion of the working population to older age groups. It provides an arguable insight into the economic progress of a country: under-developed countries with high illiteracy rates are likely to have higher fertility rates and higher mortality rates. Interestingly, the pyramids have also been used to predict economic recession and societal unrest in the eventuality of disproportionate growth in the young adult population.
In the insurance and broader financial world, there is a better understanding of the shifting lifestyle patterns and consumption demands of the elderly versus the young. In the last couple of decades, there has been a growing demand for annuities and pension products in developed western countries due to ageing populations. In Asia, retirement is less of a pressing issue with the market seeing a rise in the popularity of insurance policies with a greater investment element to cater for a growing wealthy and younger population.

With a wide base and a skinny peak – that is, a high birth rate and high mortality rates at older ages – the population pyramid takes its eponymous shape, as observed in the post-Meiji era Japan. By contrast in the UK, by 1920, due to lowering birth rates, the shape had already lost its wide base and has started to round out with an increasing proportion of the population sitting in the middle age groups.
Hollywood enters its golden age in the 1930s and coincidentally, many countries including the UK and Japan witness the birth of its so-called Golden Cohort. The cohort effect is a very interesting phenomenon, which can be followed in the shifting pyramids as the group born in the 1930s experience lower mortality rates/ higher rates of life expectancy improvement than cohorts either side of it. This is quite conspicuous in the Japanese pyramids as the bottom most bar (age group) in the 1930s moves up the pyramid over the next century and suffers from reduced shrinkage. While there is no conclusive reason for the reduction in the mortality rate of the Golden Cohort, plausible explanations include the introduction of social welfare and healthcare plus, wartime food rationing during childhood and adolescence – victory gardens might have helped this silent generation in winning a prolonged war!
As nations were rebuilt and borders redrawn in the post-WWII era, the baby boomer generation enters the scene. In both the UK and Japan, the boom comes in a couple of waves in the late forties and late sixties, leading to a widening in the bases of the pyramids for the first time in a few decades. In 2020, the baby boom has turned into a geriatric boom and has reshaped the economy, especially the global insurance market. Wealth is currently concentrated in this silver segment of the population and as this grows, age-based solutions are needed. Japan, with the fastest growing ageing population, has recently introduced state-backed long-term care insurance plans and is reconsidering the typical age-related career structure of its working population.
The picture over the last 50 years is reasonably clear – fertility rates have dropped drastically (except for some African and Asian countries), and people are living longer with better healthcare. The pyramids have rapidly descended into a shape more akin with a transposed bell curve. We can only cautiously predict what will happen to the population demographic in the future: overall the world population will continue to drop as fertility rates fall and longevity rates improve marginally. Some demographers anticipate the pyramid shape will persist to some extent, while others foresee an inverted pyramidal shape depending on the dynamics between mortality rates at older ages and fertility rates.
On the 12th January 2022, the ONS released its latest nation population projection report: the UK natural population is forecasted to start declining by 2025 and the total population, taking into account net migration, will begin to shrink from 2058, according to the ONS projections.
Do you have any questions? Please contact info@4-most.co.uk
Interested in learning more?
Contact usInsights


Breaking down the impact of M&A on IFRS 17 reporting: A Comprehensive IFRS 17 Framework for Business Combinations
22 Apr 26 | Insurance


The Renters’ Rights Act: What 2026 holds for landlords’ costs and the impact on buy-to-let (BTL) affordability
09 Apr 26 | Banking

Is your firm ready for the upcoming changes required for credit reference agency (CRA) reporting?
31 Mar 26 | Banking